

Every module in this course maps to one phase of WXM, the Wave Experimentation Model, created by Wavesy. This lesson shows the whole loop once, so the rest of the course has a shape.
Phase 1 of 4
Wonder: First, ask better questions.
Look before touching anything: analytics and tag audits, session recordings, heatmaps and funnel baselines show who arrives, what they do, where they hesitate and when they leave.
What moves forward
- A measurement baseline you can trust
- A map of the highest-value conversion journey
- Clear questions for the next phase
WhoWhatWhereWhen

Phase 2 of 4
Architect: Turn the "why" into a plan worth building.
Diagnose why people do not convert, then translate the evidence into a structured program. Each hypothesis earns its place through impact, evidence, effort and test feasibility.
What moves forward
- Evidence-backed conversion hypotheses
- A prioritized experimentation roadmap
- A scoped CRO program tied to business goals
HypothesisPrioritizationCRO program
Phase 3 of 4
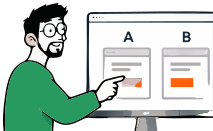
Validate: Build the variation. Let the evidence decide.
Design and build variations, QA the experience and tracking, and launch with defined success metrics. Tests run to an appropriate decision point with guardrails and statistical rigor.
What moves forward
- Variations built and quality-checked
- A/B tests with defined metrics and decision rules
- A documented result, including inconclusive tests
A/B testingQAMeasure
Phase 4 of 4
Expand: Roll out what works. Build on what you learn.
Roll winners out wherever the learning applies, raise testing velocity and feed new questions back into Wonder, with senior review at every step.
What moves forward
- Validated improvements shipped
- Learning shared across relevant journeys
- New questions for the next Wonder phase
Scale winnersRaise velocityShare learning

Each cycle makes the next one smarter: what Expand learns becomes the starting point for Wonder. WXM is the Wave Experimentation Model by Wavesy.
One problem, one full cycle
A fictional example. An online plant shop sees many shoppers leave at the shipping step.
Wonder. The team checks tracking is correct, builds the funnel (mobile loses far more at shipping than desktop), watches 30 recordings (people scroll up and down looking for delivery dates) and adds a one-question exit survey (“What stopped you today?”). Many answers mention delivery cost and timing.
Architect. Hypothesis: Because surveys and recordings show uncertainty about delivery, showing the delivery cost and date on the product page will increase completed orders. PXL score 11 of 14: noticeable, adds information, high traffic, backed by surveys and analytics, quick to build. It goes to the top of the roadmap. Primary metric: completed orders per visitor; guardrails: average order value and returns.
Validate. The variation is built and QA’d on mobile and desktop, with tracking and accessibility checks. The test runs for the two full weeks the sample size calculation requires. The result and its confidence interval are written up, whatever they show.
Expand. If it helps, the delivery promise is rolled out to every product template and the email confirmations. New questions arise (“Would a faster delivery option sell?”), and they become the next Wonder.
Practical exercise
Take the hesitation you noted in lesson 1. Write one line for each WXM phase: what you would look at (Wonder), what you'd propose (Architect), how you'd test it (Validate) and where else the learning could apply (Expand).